Overlying water Anoxic,
Sediments Anoxic+Organics
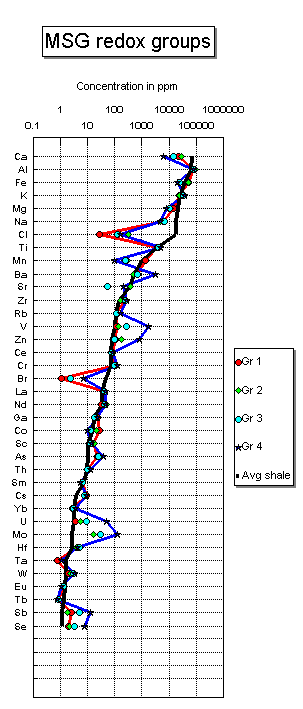
        REDOX  GROUPS in ppm
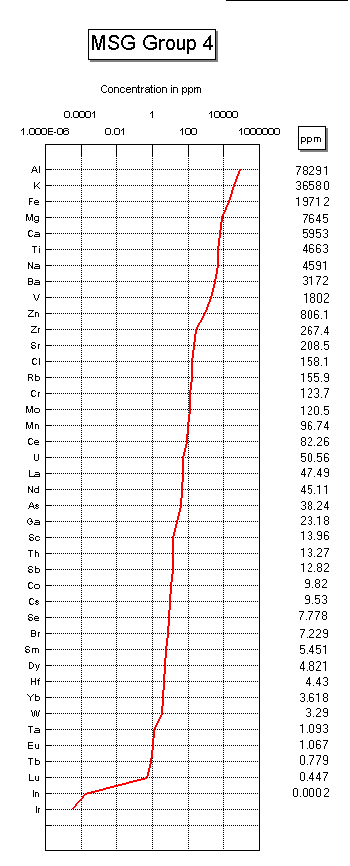
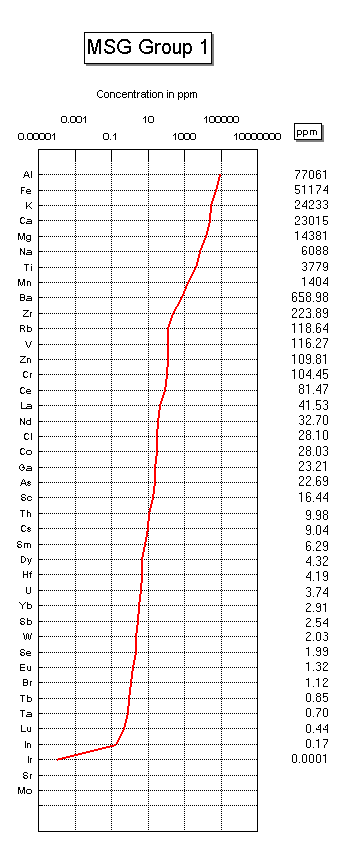
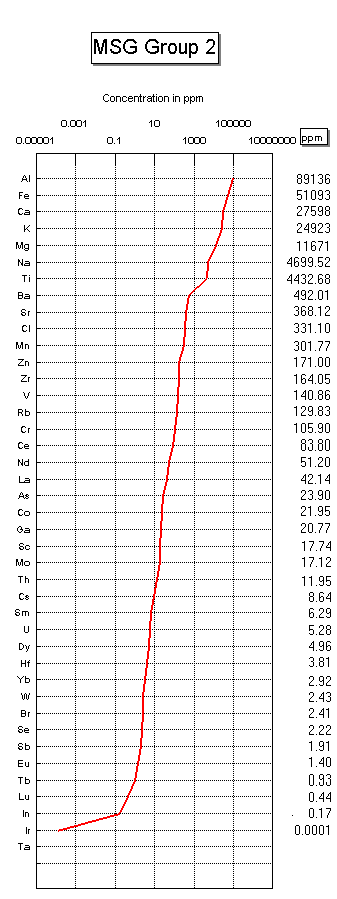
Elem.	 I	 2	3	4
Na 	6088	4700	6492	4591
Mg 	14381	11671	10165	7645
Al	77861	89136	75367	78291
Cl 	28	331	129	158
K 	24233	24923	33668	36580
Ca	23015	27598	14162	5953
Sc 	16	18	13	14
Ti	3779	4433	4098	4663
V	116	141	267	1802
Cr 	104	106	94	124
Mn 	1404	302	243	97
Fe	51174	51093	23368	19712
Co	28	22	13	10
Zn	110	171	95	806
Ga	23	21	18	23
As	23	24	24	38
Se	2	2	3	8
Br	1	2	2	7
Rb 	119	130	120	156
Sr 	0	368	52	209
Zr 	224	164	239	267
Mo 	0	17	29	121
In	0.166	0.172	0.220	0.171
Sb	2.54	1.91	4.86	12.82
Cs	9.04	8.64	7.58	9.53
Ba	659	492	713	3172
Hf 	4.19	3.81	5.01	4.43
Ta 	0.781	NA	 NA	1.093
W	2.03	2.43	3.10	3.29
Th 	9.98	11.95	9.93	13.27
U	3.74	5.28	8.89	50.56
Ir	 96e-6	116e-6	101e-6	27e-6
La 	41.53	42.14	41.83	47.49
Ce 	81.47	83.80	75.58	82.26
Nd 	32.70	51.20	40.51	45.11
Sm 	6.29	6.29	6.47	5.45
Eu 	1.32	1.40	1.25	1.07
Tb	0.853	0.931	0.848	0.779
Dy 	4.32	4.96	4.69	4.82
Yb 	2.91	2.92	2.92	3.62
Lu	 0.439	0.437	0.425	0.447
Groups with elements listed in order of abundance.
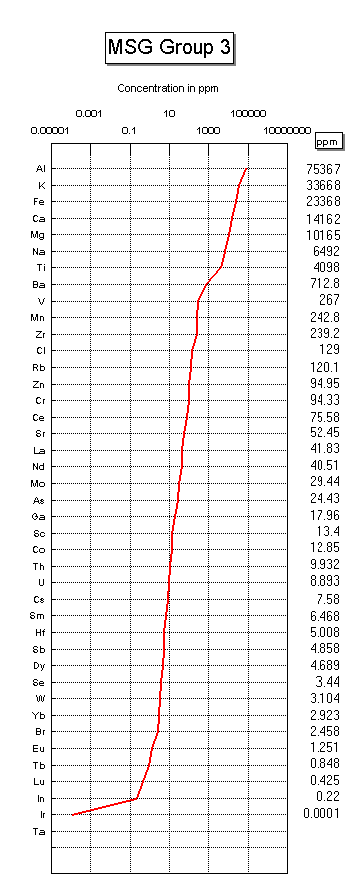
Group 4 -
Overlying water Anoxic,
Sediments Anoxic+Organics

All groups plotted in order of "Average" shale.
"Average" shale from Drever, J. I., Li, Y-H, and
Maynard, J. B., 1988, Geochemical Cycles: The
Continental Crust, in Geochemical Cycles in the
Evolution of the Earth, C. B. Gregor, Garrels, R. M. ,
Mackenzie, F. T. and Maynard, J. B. (eds.)
J. Wiley, p. 17-53
