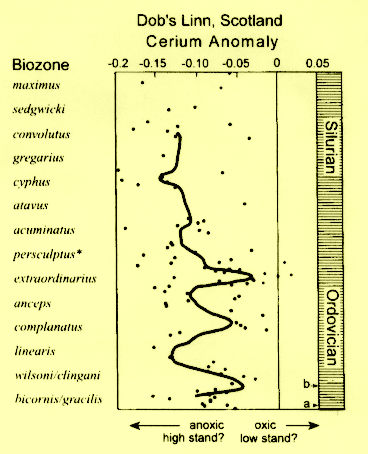
 Figure 1. The relationship between the cerium anomaly, and the eustatic
sea-level curve as a function of graptolite biozones from the middle Ordovician-
Early Silurian section at Dob's Linn, Scotland. The asterisk indicates the Ordovician-
Silurian boundary zone. Conventionally, base persculptus was chosen as the base
of the Silurian. More recently, the OrdovicianSilurian boundary commission is
considering placing the boundary at the base of acuminatus. Due to the uncertainties
of zonal designation in the lower part of the section, the depicted wilsoni biozone
represents a combined clingani / wilsoni biozone and the depicted gracilis biozone
represents a combined bicornis/gracilis biozone. The whole-rock cerium anomaly is
defined using lanthanum-samarium: log(5Ce* /4La* + Sm* ) with the whole-rock
elemental abundance normalized to chondrite (Haskin et al., 1966). Dots depict
anomalies calculated from raw data (data available on request); the solid line is
calculated from the sequential raw data using a Spencer 21-term filter (Davis and
Sampson, 1973, p. 226). Point a is off-scale, at +0.066; point b is at +0.147.