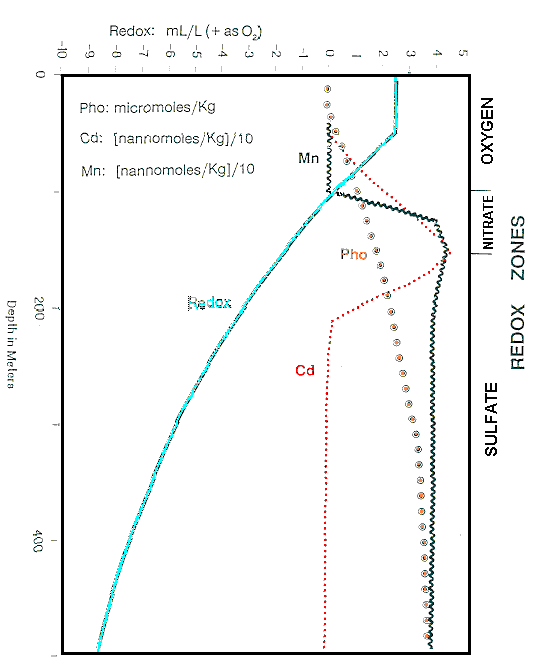
 Figure 10: SILURIAN OCEANIC NURIENT AND METAL PROFILES. For Upper Mixed Layer (0- 100
meters) and Upper Pycnocline (100- 500 meters).
REDOX calculated after Wilde (1987) using a mean
Silurian atmospheric oxygen content of 50% PAL [Present Atmospheric Level] (Budyko, Ronov and
Yanshin, 1985, p. 101) for tropical [Surface Water Temperature = 25°C] and non-glacial conditions
[P04] PHO calculated as function of redox (Redfield, Ketchum and Richards, 1963; Richards, 1965;
Wilde, 1987).
NURTIENT-RELATED METALS as Cd calculated as function of PHO (Quinby-Hunt
and Wilde, 1987, p. 171) above Zone of Sulfate Reduction. Cd in Zone of Sulfate Reduction by analogy
with Cariocao Trench (Jacobs, Emerson and Huested, 1987). Other nutrient-related metals with high
solubility products as sulfides such as Cu. Zn, Ni, Ag would have similar shaped profiles as Cd, but with
different concentrations. Other nutrient-related metals with insignificant sulfide phases would plot
following PHO curve.
REDOX-RELATED METALS as Mn plotted by analogy with the Cariocao
Trench (Jacobs, Emerson and Huested, 1987). Other redox-related metals such as Fe and Co would plot
generally following Mn curve except Fe would remain essentially zero until the top of the Sulfate
Reduction Zone.
 Figure 10: SILURIAN OCEANIC NURIENT AND METAL PROFILES. For Upper Mixed Layer (0- 100
meters) and Upper Pycnocline (100- 500 meters).